As one of Rochester’s resident data geeks, I often find myself explaining why we don’t know what we don’t know. At the “micro” level—e.g. an individual firm—we have become accustomed to knowing more and more about our customers and what they buy, where they buy it and when they buy it. A sophisticated food retailer like Wegmans, for example, can tell you how many gallons of milk were sold yesterday at each of its 89 stores. I wouldn’t be surprised to learn that they could tell us how many gallons of 2% were sold in Pennsylvania last Tuesday between 10 and 11 am! High volume, low margin retailers depend on this information to keep the shelves filled, satisfy customers, and improve their bottom line.
Aggregate information about our communities—milk consumption is one thing but what about more consequential information about employment, income and educational attainment—is far more difficult to obtain. We rely on the same sources of information we’ve used for decades. Data on employment and earnings still depend on twice a year reporting from firms covered by federal unemployment insurance. The state and federal labor departments supplement with monthly sampling that give us a snapshot of trends that have yet to be reported under the unemployment insurance program. Just in the last decade we’ve had access to labor data that matches reporting by firms to income tax records, although this takes time and is only available after a couple of years have passed.
When the Rochester Business Journal asked CGR if we could provide statistics on employment by occupation by race, we explained that the Census Bureau didn’t produce these tables. If you go to Census’ American Community Survey, you’ll observe that all of the pieces are there—employment levels, occupation, personal income, race—but they’ve not been tabulated together.
Fortunately, the Census Bureau offers enterprising users the opportunity to work with a sample of actual Census survey responses, mixing and matching and cross tabbing to their heart’s content. It’s a data geek’s dream! Let me give you an example. I’m looking at my copy of the American Community Survey questionnaire and see that the form asked how I traveled to work last week and how I heated my house. Given access to the full data file, it would be possible to find out how many bicycle commuters in Monroe County heated their home with wood. The Public Use Microdata Sample (PUMS) makes this possible.
A word of caution—this may be a data geek’s dream, but it is a data newbie’s nightmare. The challenges of sample weighting and significance estimating are not to be taken lightly. So don’t try this at home.
For the Smriti Jacob’s story on opportunities for black professionals, we downloaded a sample of all responses gathered by the Census Bureau’s American Community Survey over the period. The geographic area isn’t precisely the same as the Rochester Metropolitan Statistical Area, but it is close. PUMS data are reported by Public Use Microdata Areas (PUMAs!), which don’t perfectly align with other census geography. The 2010-2014 PUMS sample includes 5% of the U.S. population.
The file we extracted is a cross tabulation showing the number of individuals in a particular occupation by race, with personal income summed for each category. The software we use weights the sample. The number of individuals in each category is, thus, an estimate for the entire population. Let me give you an example.
These data estimate that the Rochester area includes 925 individuals who report their occupation as “psychologist,” that 815 are white, 84 are black and 26 are Asian. It reports that 20 are Hispanic (of any race). Total personal income for this group is $57 million, so average personal income is about $62,000. Annual earnings for white psychologists is estimated at just over $63,000 with black psychologists earning about $52,000.
This all sounds very definitive and precise, but in truth, it’s far from it. As an example, these data indicate that there are no economists in the Rochester area. Having filled out my American Community Survey form a few years ago, I know that there is at least one economist in the ACS sample. Sadly, the portion of the ACS sample that found its way into PUMS failed to select my form or any others of my tribe!
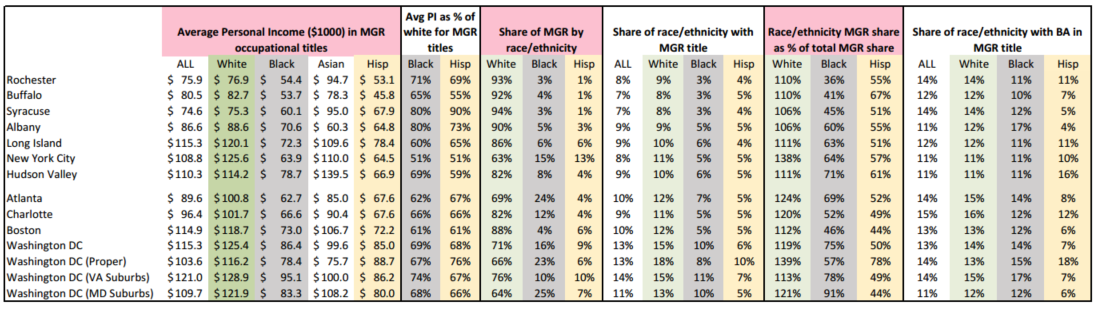
The rest of the analysis is also far from straightforward. Given RBJ’s interest in professional employment by race, we selected all occupations that were coded by Census as “MGR”—which ranges from “MGR-CHIEF EXECUTIVES & LEGISLATORS” to “MGR-FOOD SERVICE MANAGERS.”—Given that the latter could be a shift manager at McDonalds, which was not the focus of the story, we created a new category for MGR occupations with average incomes over $40,000. Based on this classification, 93% of MGR jobs are held by whites in Rochester and only 3% by blacks. That’s quite a contrast with Atlanta where blacks hold 24% of MGR positions, about 7x the Rochester proportion.
Population shares vary considerably by race, however. Blacks comprise 35% of the working age population in Atlanta but only 9% in the Rochester Metropolitan Area. Here’s the adjusted comparison: In Rochester, about 8% of the total working age population is in managerial titles overall. Nine percent of whites are in these titles compared to only 3% of blacks. Adjusted for population, blacks’ share of managerial positions still falls far below what you would expect, if the share held by blacks was equal to the share for the population as a whole. The number for whites is about 110% of expected; for blacks, only 36% of expected. Blacks’ share of managerial positions, as a share of expected positions, is 41% in Buffalo, 69% in Atlanta and 91% in the Washington D.C.’s Maryland suburbs.
Many factors influence these figures. Our community has been failing our poor black youth for generations, for example. If Rochester’s black working age population has lower educational attainment, then its ability to compete for managerial positions will also be lower. These data estimate that 11% of blacks with at least a bachelor’s degree hold managerial titles in Rochester, compared with 14% overall, thus 81% of what we would expect if they held a share equal to the share held by all with a BA or higher degree. Atlanta, by contrast, has near parity with blacks with a BA or higher degree holding the expected share of managerial degrees, also about 14%. Blacks in Washington, D.C. with a BA or higher hold a higher proportion of managerial positions than the population average.
I could go on—but this is a complicated story. We looked at the distribution by race and ethnicity by occupations at 1.5 times the average for all occupations. Sadly for Rochester, the story doesn’t change—opportunities for blacks in Rochester fall behind those in other cities. The same disparity is not as apparent for Hispanics. The comparison for MGR titles for all of our selected cities appears below. If you would like to explore this large and complex dataset for yourself, feel free to email me.