Guest Commentary from Geoff Rosenberger, CGR Trustee
The Social Security Trustees recently released their 2014 Annual Report. The Wall Street Journal carried a story about the report, but didn’t provide much detail (see The Hard Numbers on Social Security -also see How Should the Government Change Social Security? )
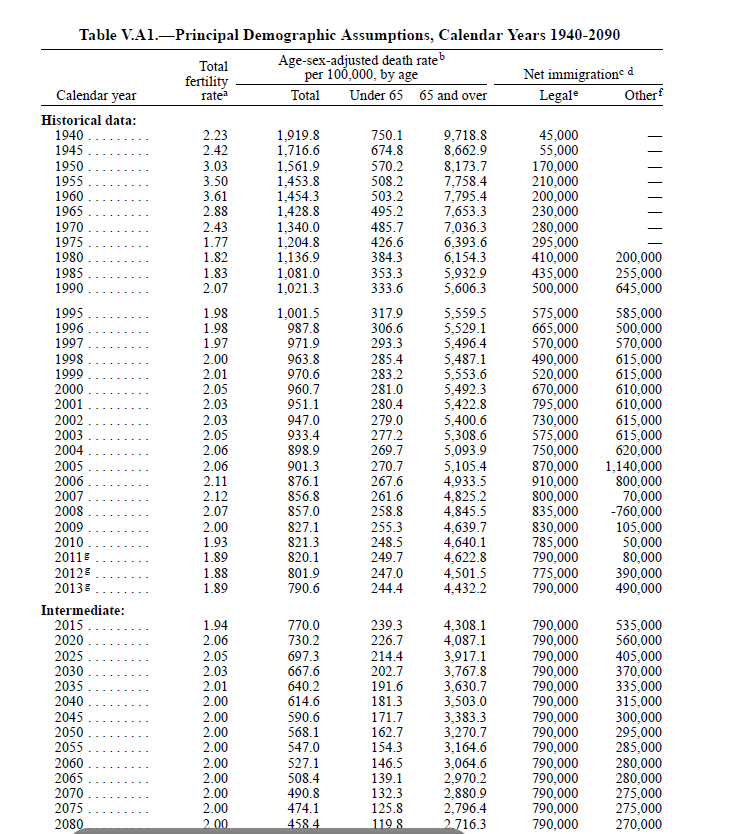
The long term projections are of course tenuous and highly susceptible to even subtle changes in assumptions around wage rates, demographics, immigration, GDP growth, inflation and a myriad of other factors. But there is still enough meat here to provoke a lot of thought. Note especially the charts and graphs at the end of this post!
First of all, a few things to remember:
1) Social Security is composed of two separate and distinct programs – Old Age and Survivors Insurance (OASI), and Disability Insurance (DI) which are funded by a combined 12.4% payroll tax, which is split 50/50 among employer and employee. The remaining 2.9% of FICA (1.45% for both employer and employee) funds the Medicare program. So, while benefit payments are essentially locked in as an entitlement, the revenue side of the equation –15.3% of payroll – is highly sensitive to changes in employment levels as well as changes in rates of pay. Therefore, any future solvency forecasts are highly exposed to changes in economic activity.
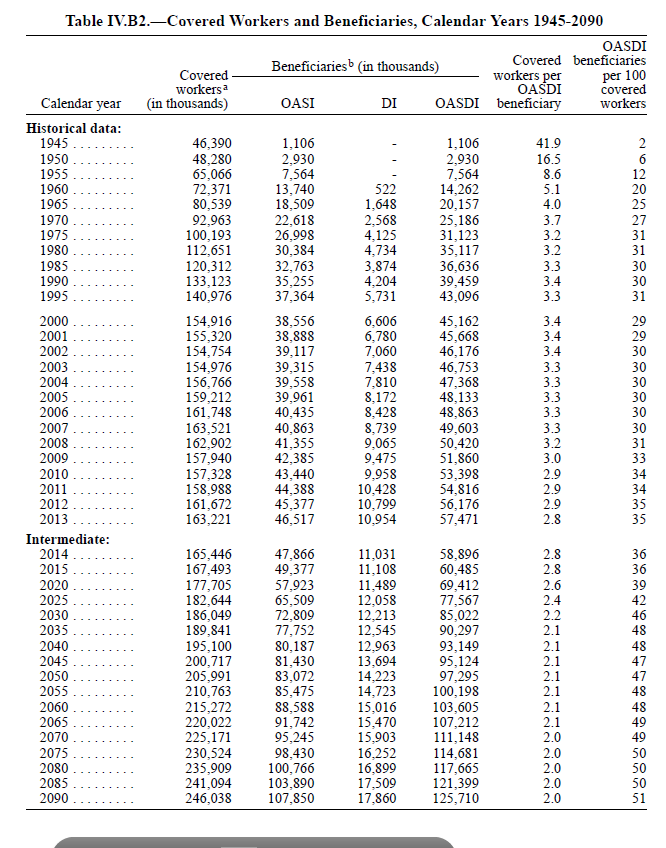
2) There are 59 million Social Security Recipients, which represent 18.6% of the U.S. population.
3) The “assets” of both the OASI and DI programs are composed of a special class of U.S. Treasury Bonds, which are non-tradable and issued to the OASI and DI Trust Funds as little more than IOU’s from the U.S. Treasury Department. Since they aren’t traded, I don’t believe the Trust Fund marks them to market (see definition here: http://www.investopedia.com/terms/m/marktomarket.asp) and so are carried on the books at face value.
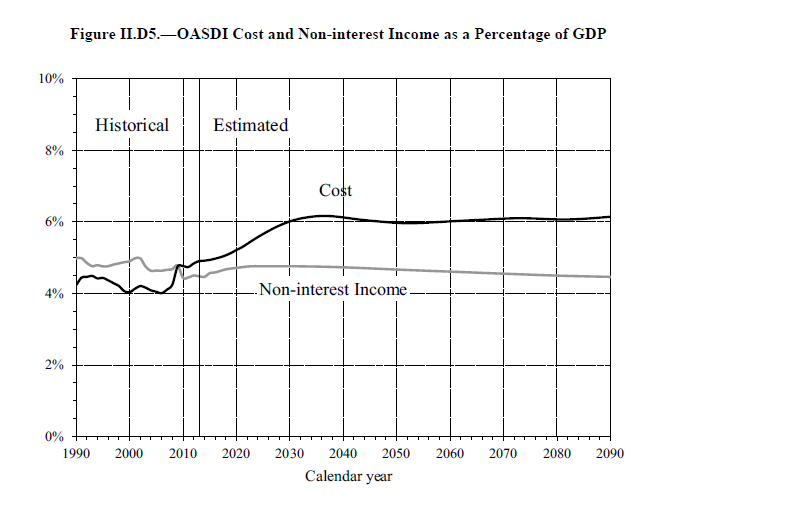
4) When the Trustees talk about “solvency” they are referring to the length of time it will take for those accumulated IOU’s from the Treasury to run out. It’s little more than a bookkeeping exercise. The more important numbers to focus on are the current and future year cash flows, which turned negative in 2010 and look to remain negative for the foreseeable future. In short, there is now more money going out in benefit payments than there is FICA revenue coming in.
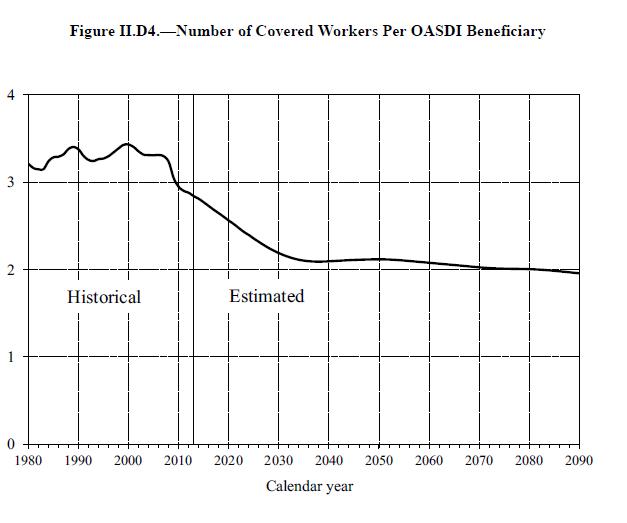
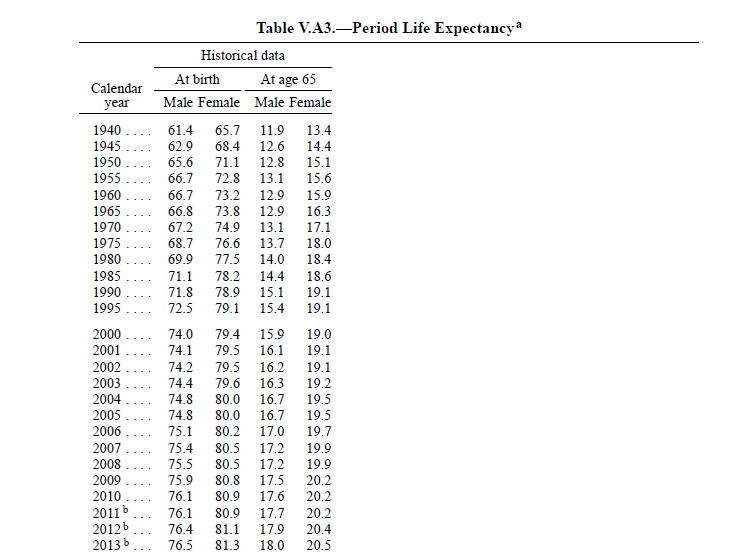
5) The revenue side of the ledger is very difficult to forecast going forward because of the myriad of assumptions that need to be made. But the expenditure side is pretty predictable. We know who the beneficiaries are and we know how much in the way of accrued benefits they are entitled to. Yes, mortality rates change over time, but the changes are gradual and while they may have an impact in the out years. For the next couple of decades, we pretty much know what the cash outflow is going to look like.
So, with that said, here are the key things to consider from the report:
1) The DI Trust Fund is projected to run out of money (IOU’s) in 2016. The OASI Trust Fund is projected to go broke in 2033. When that happens, unless Congress and the President act to transfer General Fund revenue into the SS system, Disability Benefits starting in 2017 will have to be reduced to 81% of their current formula levels – i.e. the amount that can be funded via the FICA revenue that is coming in. For OASI, come 2033 – again based on a whole bunch of assumptions – SS benefits would then have to be reduced to 77% of formula levels, again, the amount that can be sustained from annual FICA cash inflows.
2) In order to restore both OASI and DI to the point where their FICA revenue will be sufficient to fund annual benefits at current levels, FICA payroll taxes will need to increase by 2.83% of payroll, from 12.4% to 15.23%, plus the 2.9% Medicare tax. So, in total, FICA taxes would need to increase from 15.3% to 18.13% (9.07% each for employer and employee, up from today’s 7.65%).
3) The Net Present Value of all the Accrued and Unfunded Social Security Benefits totals $10.6 trillion. That works out to $33,400 per citizen or $133,600 per family of four. But, that’s over the course of the next 75 years and again, a lot of assumption go into that calculation. However, on a more personal basis, I’m 61 years old and so my actuarial life expectancy is 81 ½ years — i.e. I should expect to live to the end of calendar 2034. The NPV of the Unfunded Social Security Benefits between now and my projected date of demise is $1.0 trillion. So, yes, the long range numbers are scary. But, the intermediate numbers aren’t anything to be complacent about either.
4) The Trustees’ math incorporates interest income from the Treasury Bonds the Trusts hold. Last year, that interest income totaled $102.8 billion, or 3.75% of the Fund’s combined $2.764 trillion of Treasury IOU’s. But, last year’s newly issued IOU’s only yield 1.75%, so that interest income will be trending down in future years as the older, higher yielding notes mature. If you ignore the phantom interest income, on a strictly cash flow basis, looking at just FICA payroll revenue and benefits paid, OASI took in $621 billion last year and paid out $672 billion in benefits, for a cash flow shortfall of $51 billion. The DI Trust Fund took in $105 billion and paid out $140 Billion, for a cash outflow of $34 billion. The combined interest income on the Treasury notes was $103 billion.
Below you will find some of the more sobering graphs and charts: