 The yield curve compares interest rates charged on long term and short term bonds—typically, 10 year v. 2 year U.S. Government treasuries. When the 10 year rate is lower than the 2 year rate, the yield curve is said to be “inverted” and may be “predicting” a recession.
The yield curve is nothing but a sophisticated investor confidence survey—if investors expect inflation will rise, then they will demand a higher yield (or interest rate) for longer maturity bonds. 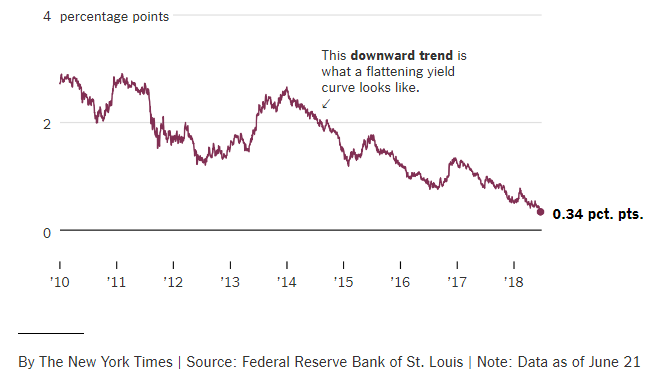
Some of you may remember the TV series, Early Edition. Every morning the protagonist found tomorrow’s newspaper outside his door. Blessed (or cursed) by knowledge of the future, he spent the rest of the episode trying to fix things.
Suppose you found the Wall Street Journal from 2028 on your doorstep or in your email’s inbox and learned that inflation, 2% today, had risen steadily to 5%. To compensate for the loss in inflation-adjusted yield (the interest rate minus inflation), you would demand a higher interest rate for bonds with longer maturities.
On the flip side, if your “early edition” of the WSJ showed inflation to have stayed the same or fallen, you’d be willing to accept a lower yield (rate of interest).
The key to interpreting the yield curve is this: Inflation is usually associated with a thriving economy. If bond traders accept a lower interest rate for longer maturities (that’s the inverted yield curve), then they must be expecting the economy to slow down. And vice versa. Bond traders express their opinions with their dollars.
They are not always right; bond traders are just as subject to “group think” as anyone else. Still, a flat or inverted yield curve has a real impact on banks as they are in the business of borrowing at low current rates and lending at higher long rates. They lend less when the yield curve is flat or inverted. Moreover, expectations can be contagious. Fears of recession can spur a reduction in investment and risk taking and make a recession more likely.
How does this apply to Rochester/Finger Lakes?
National economic trends do not affect all regions alike. When Rochester’s economy was intimately tied to Eastman Kodak, it was insulated from many of the ups and downs affecting the nation. Kodak’s principal product, photographic film, was a consumer staple. When the economy slowed, vacations might be scaled back—a distant destination might be replaced with a more modest trip. Parties might be less grand. But pictures were still part of our culture. And Kodak’s consistent profitability made the cycles of hiring and firing that were common to more cyclical or competitive businesses unnecessary.
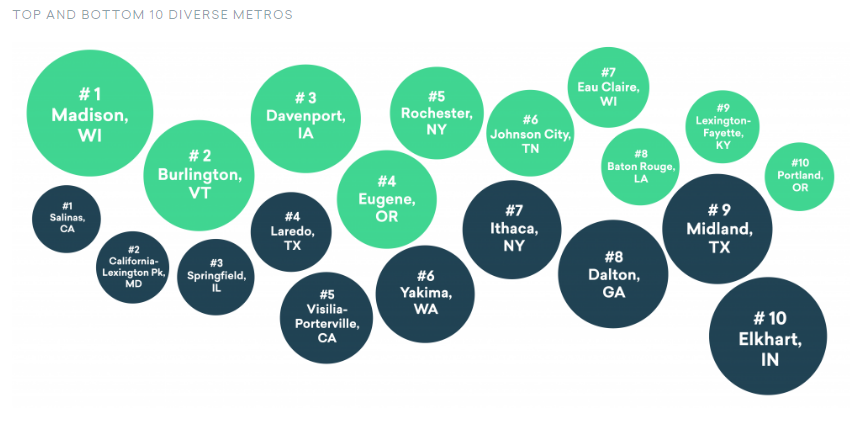
Today, Rochester’s economy counts as one of the most diversified. The economic analysis firm EMSI recently ranked the nation’s metros on the underlying diversity of employment and Rochester ranked #5. This is in sharp contrast to the days when the “Big Three” (Kodak joined by Xerox and Bausch & Lomb) drove most economic activity. A similar study from the 1980s ranked Rochester as the least diversified large economy in the nation.
So the insulation from external events is largely gone. Just like the rest of the economy, Rochester needs to pay attention to national indicators. That said, neither a falling yield curve nor even an inversion is destiny. Most indicators suggest that the national economy is doing just fine and that growth will continue apace.