
 Oscar Wilde’s quip, “the truth is never pure and rarely simple,” is flagrantly ignored by the “Best Places/Top Cities” industry. Yes, these “top XX” lists have been around since Athens v. Sparta. We’ve had decades with the “Best Places to Live” lists; U.S. News & World Report turned rankings into a market segment. For WalletHub, with revenue driven by the “eyes” attracted to its website, it’s the whole business model. And now that we’re awash in data, it is ever cheaper to capture someone’s attention with a new ranking. Should we be paying attention?
We’re a competitive species, to be sure. Athletic team loyalty competes with religious affiliation in some families. A Catholic might marry a Jew, but some Yankee fans wouldn’t date, much less marry, a Red Sox fan.
Comparisons have a place. Rankings help us respond to needs. We’re not surprised that Chicago, like many large cities, experiences violent crime. What sets off alarm bells is that its murder rate in 2015 (18/100,000 population) was more than 4 times New York’s (4/100,000) and 2.5 times Los Angeles’s (7/100,000). The comparison prods us to ask, “What’s different in Chicago?” And after comparing 2015 in Chicago to prior years in Chicago, we ask, “Why is the problem getting worse?”
 Yet many rankings are judgments, not statistics—instead of the murder rate, WalletHub might call this “Best & Worst Cities for Policing” and put Chicago and poor Baltimore on the bottom. The murder rate is a fact; the quality of policing is a judgment call. Some of these judgments deserve our attention, many should not. Let’s look at a few rankings from WalletHub:
Most & Least Happy States: This ranking includes the state’s “hedonometer score,” which claims to measure “the personal expression of hedonism on social media.”—hedonists are happier, apparently. Also included are rates of sleep adequacy, suicide, divorce and sports participation; plus the number of work hours, WalletHub’s weather ranking, and many more, all weighted by no objective criteria. The happiest people, FYI, are in Utah and Minnesota. Our sympathies to folks in Alabama or West Virginia. Perhaps they should move to Provo or Bemidji.
Cities with Best & Worst Weather: Each city is ranked by how it conforms to WalletHub’s “ideal weather” by season. Summed, the 4 season rankings give the overall score. What’s weather’s ideal? Apparently, Fall should have an average daily tempera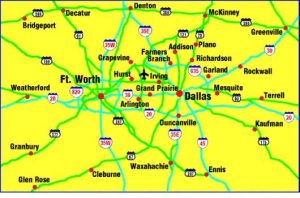 ture of 65, 0.8” of daily precipitation and a 5% chance of fog. Winter’s average temperature should be 45 with a 7% chance of snow. And so on. No surprise, California cities take the top 14 places. Rochester, MN (44° N. latitude) ranks 58 while Rochester, NY (43° N. latitude) ranks 99. Three Alaska cities, along with Syracuse & Youngstown, share 100, the bottom rank. Boston and Providence are close by at 98. How about this? The easiest way to improve your hometown weather is to move from Dallas (#82) to Ft. Worth (#34).
Best & Worst Cities for Singles: Of the various criteria offered, the % of singles is certainly relevant—but it counts for only 7 of 100 total points. The combined cost of beauty salons and a haircut edges it out at 9 of 100. The remainder of the criteria address other cost factors—taxis, restaurant meals—and entertainment opportunities like shopping centers and bars per capita. The odd results speak for themselves. Salt Lake City—not usually mentioned for its hot singles action—is #1. Tempe & Scottsdale, AZ are #3 and #5, respectively, which certainly rings true if you’re over 75. The real telltale is that Phoenix is ranked #45. If you don’t know the area, Tempe & Scottsdale are completely entwined in Phoenix. New York City, which added 132,000 25-34 year olds from 2010-15 (voting with their feet), is #139. Yonkers takes the bottom spot, #150.
Most Pet Friendly: Pet-friendly trails per capita gets 6 points (what does it mean for a trail to be pet friendly? And does anyone really have this kind of information?). WalletHub’s insightful weather ranking (skewered above) also gets 6 points. Average home square footage gets 5 (you need a big house for a Shi-Tzu?), as does % of single family detached home s (someone forgot to tell those dog owners in Manhattan). Orlando tops the list. Birmingham ranks #2—but might the dogs be affected by Alabama’s low happiness rating? New York takes the bottom slot, its abundant and active dog parks notwithstanding.
Even if you accept the criteria, there are other reasons to dismiss these rankings. First, many rankings from WalletHub and others are explicitly limited to city boundaries. Others don’t say and are likely mixing city and metro statistics willy-nilly. The balance of “city proper” and suburb varies considerably from city to city, even region to region. Cities in the West learned a lesson from places like Rochester and have aggressively annexed their urbanizing fringe. While metro statistics are not perfect, the choice of “city proper” distorts many of these measures. For most people, quality of life applies to the metro area, not just the boundaries of our central city. Rochester scores rather poorly on “shopping centers per 100,000” as retail has moved to the suburbs. Do singles find Rochester area shopping substandard? The city is just the wrong unit of analysis.
There are countless rankings, some better than others. Allstate Insurance publishes America’s Best Drivers Report. U.S. News & World Report seems to have shriveled to little more than rankings. Search for “best places” on Google and it finds nearly a billion sites.
I’m hereby begging the Rochester Business Journal (biting the hand that prints me!) and other media outlets to establish some criteria before giving these lame rankings any ink:
- Does the geography make sense, e.g. is “city” the right unit of analysis?
- Are the measures rationally connected to the question at hand, e.g. the cost of a haircut & the singles scene?
- If the measures are reasonable, are the data used (like pet-friendly trails) plausibly accurate?
- Finally, do the results pass the sniff test? The Dallas/Ft Worth or Phoenix/Tempe/Scottsdale comparisons are an easy place to start.